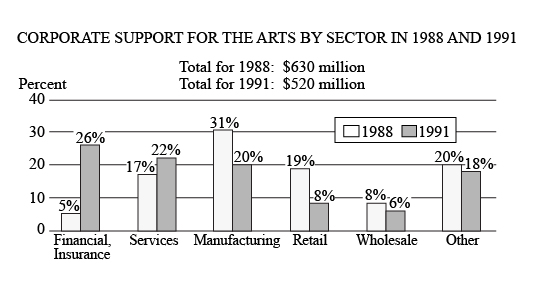
How many of the six corporate sectors listed each contributed more than $\$60$ million to the arts in both $1988$ and $1991$ ?
- One
- Two
- Three
- Four
- Five
So, you were trying to be a good test taker and practice for the GRE with PowerPrep online. Buuuut then you had some questions about the quant section—specifically question 14 of the second Quantitative section of Practice Test 1. Those questions testing our knowledge of Graphical Methods for Describing Data can be kind of tricky, but never fear, PrepScholar has got your back!
Survey the Question
Let’s search the problem for clues as to what it will be testing, as this will help shift our minds to think about what type of math knowledge we’ll use to solve this question. Pay attention to any words that sound math-specific and anything special about what the numbers look like, and mark them on our paper.
Oh, a clustered bar graph! This should be fun. It’ll definitely draw on what we’ve learned about Graphical Methods for Describing Data. Let’s keep what we’ve learned about this skill at the tip of our minds as we approach this question.
What Do We Know?
Let’s carefully read through the question and make a list of the things that we know.
- We have a clustered bar graph
- We want to know how many of the six sectors gave more than $\$60$ million in both $1988$ and $1991$
Develop a Plan
The clustered bar graph gives us: 1) the total contributed in both $1988$ and $1991$ and 2) the percentage of contribution by sector for each year. The question asks for a contributions in terms of dollars, but our clustered bar graph has percentages listed. So let’s convert the $\$60$ million into a percentage for each year, then we can see which sectors exceed that percentage in both years.
Solve the Question
In $1988$, the total contribution was $\$630$ million. Let’s find out what percentage $\$60$ million is of $\$630$ million, as this will give us the minimum percentage each sector must have for $1988$.
| $1988 \Minimum \Percent$ | $=$ | ${\$60 \million}/{\$630 \million}· 100%$ |
| $ $ | $ $ | |
| $1988 \Minimum \Percent$ | $=$ | $9.52%$ |
Let’s do the same for $1991$, where the total contribution was $\$520$ million.
| $1991 \Minimum \Percent$ | $=$ | ${\$60 \million}/{\$520 \million}· 100%$ |
| $ $ | $ $ | |
| $1988 \Minimum \Percent$ | $=$ | $11.54%$ |
Nicely done! Alright, now we need to find which sectors have a percentage greater than $9.52%$ in $1988$ and also greater than $11.54%$ in $1991$. Scanning our clustered bar graph, we can see that the Services, Manufacturing, and Other sectors satisfy these criteria. So a total of three different sectors.
The correct answer is C, Three.
What Did We Learn
The question gave us a dollar value, but the clustered bar graph gave us percentages. In situations like these, we need to convert either the dollar value to a percentage or the percentages to a dollar value. It was definitely much more efficient to convert the single dollar value to a percentage for each year instead of converting all twelve percentages in the clustered bar graph to dollar values.
Want more expert GRE prep? Sign up for the five-day free trial of our PrepScholar GRE Online Prep Program to access your personalized study plan with 90 interactive lessons and over 1600 GRE questions.
Have questions? Leave a comment or send us an email at [email protected].