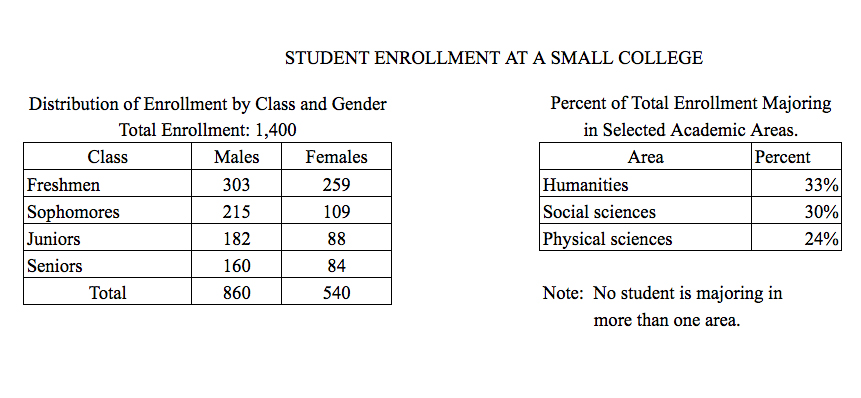
 Students not majoring in humanities constitute what percent of the total enrollment?
- $54%$
- $67%$
- $70%$
- $76%$
- $77%$
So, you were trying to be a good test taker and practice for the GRE with PowerPrep online. Buuuut then you had some questions about the quant section—specifically question 16 of the second Quantitative section of Practice Test 1. Those questions testing our knowledge of Graphical Methods for Describing Data can be kind of tricky, but never fear, PrepScholar has got your back!
Survey the Question
Let’s search the problem for clues as to what it will be testing, as this will help shift our minds to think about what type of math knowledge we’ll use to solve this question. Pay attention to any words that sound math-specific and anything special about what the numbers look like, and mark them on our paper.
Looks like we’ll need to analyze two tables containing data in this question, so it likely will draw on what we’ve learned about Graphical Methods for Describing Data. Let’s keep what we’ve learned about this skill at the tip of our minds as we approach this question.
What Do We Know?
Let’s carefully read through the question and make a list of the things that we know.
- We want to find the percent of students NOT majoring in humanities
Develop a Plan
We want to know the percent of all of the students who are not majoring in humanities. The second table tells us that the percent of students who ARE majoring in humanities is $33%$. Since the total for all students must sum up to $100%$, let’s just subtract $33$ from $100$ to get our answer.
Solve the Question
Since $100%-33%=67%$, the correct answer is B, $67%$.
What Did We Learn
Sure, that problem seemed simple enough, but if we look closely, we can see the trap the test writers were trying to get us to walk into. The second table shows that $30%$ of the students are majoring in social sciences and $24 %$ of the students are majoring in physical sciences. We know there’s someone out there who just leapt to the conclusion that the percentage of students not majoring in humanities must be the sum of these other two academic major areas: $24%+30%=54%$. And what do you know…$54%$ is one of the wrong answer choices! Very tricky indeed! Seems like the real lesson to learn from this question is to read data analysis questions involving graphical displays of data very carefully. We even need to read the titles and footnotes of tables.
If we only pay attention to the numbers in the tables, mistakes are more likely to happen.
Want more expert GRE prep? Sign up for the five-day free trial of our PrepScholar GRE Online Prep Program to access your personalized study plan with 90 interactive lessons and over 1600 GRE questions.
Have questions? Leave a comment or send us an email at [email protected].