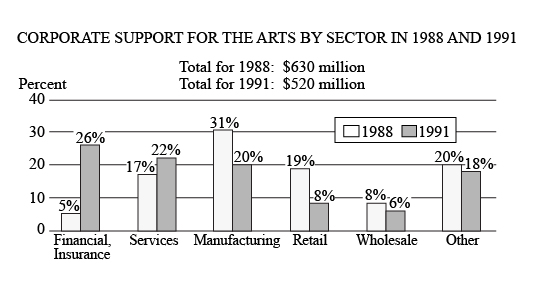
The two corporate sectors that increased their support for the arts from $1988$ to $1991$ made a total contribution in $1991$ of approximately how many million dollars?
- $112$
- $125$
- $200$
- $250$
- $315$
So, you were trying to be a good test taker and practice for the GRE with PowerPrep online. Buuuut then you had some questions about the quant section—specifically question 16 of the second Quantitative section of Practice Test 1. Those questions testing our knowledge of Graphical Methods for Describing Data can be kind of tricky, but never fear, PrepScholar has got your back!
Survey the Question
Let’s search the problem for clues as to what it will be testing, as this will help shift our minds to think about what type of math knowledge we’ll use to solve this question. Pay attention to any words that sound math-specific and anything special about what the numbers look like, and mark them on our paper.
Oh, a clustered bar graph! This should be fun. It’ll definitely draw on what we’ve learned about Graphical Methods for Describing Data. Let’s keep what we’ve learned about this skill at the tip of our minds as we approach this question.
What Do We Know?
Let’s carefully read through the question and make a list of the things that we know.
- We have a clustered bar graph
- We want to know how much two sectors contributed in $1991$, choosing the two sectors that increased their total contributions going from $1988$ to $1991$
Develop a Plan
First, let’s identify which two sectors increased their contributions going from $1988$ to $1991$. Looking at the percentages on the clustered bar graph, we can see that the Financial and Services sectors have higher percentage contributions in $1991$ than they do in $1988$, and the other four sectors have percentage contributions that decreased going from $1988$ to $1991$. So looks like we’ll want to focus on the Financial and Services sectors for this question.
We want to know the total amount the Financial and Services sectors contributed in $1991$. From the clustered bar graph, we can see that their percentages in $1991$ are $26%$ and $22%$, giving us a total of $26%+22%$, or $48%$. So let’s plan to multiply the total amount in $1991$, which was $\$520$ million, by $48%$ to find the dollar amount contributed here.
Solve the Question
Conveniently for us, $48%$ is very close to $50%$. We can actually just estimate the dollar amount,
as we know that $50%$ of something is just half of it. So $50%$ of $\$520$ million is:
$${\$520\million}/2=\$260 \million$$
So we need an answer choice that’s just slightly under $\$260$ million. Scanning the answer choices, we can see that $\$250$ million is the closest answer that is just slightly under $\$260$ million. So the correct answer is D, $\$250$ million.
What Did We Learn
Estimation can be a very powerful tool. Here, we didn’t really need to multiply the total dollar amount by the exact percentage. It was much easier to see that $48%$ was very close to half of the total contribution in $1991$, and then we could just divide the total contribution in $1991$ by $2$ to get a great estimate for our answer.
Want more expert GRE prep? Sign up for the five-day free trial of our PrepScholar GRE Online Prep Program to access your personalized study plan with 90 interactive lessons and over 1600 GRE questions.
Have questions? Leave a comment or send us an email at [email protected].